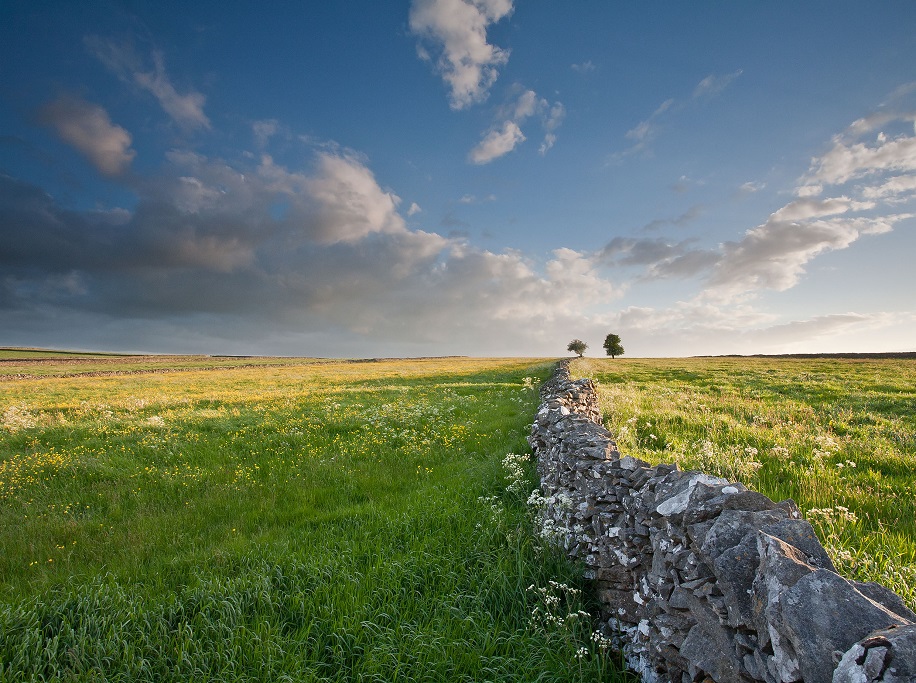
Beautiful views created by contrasting landscapes and dramatic geology
# Land cover
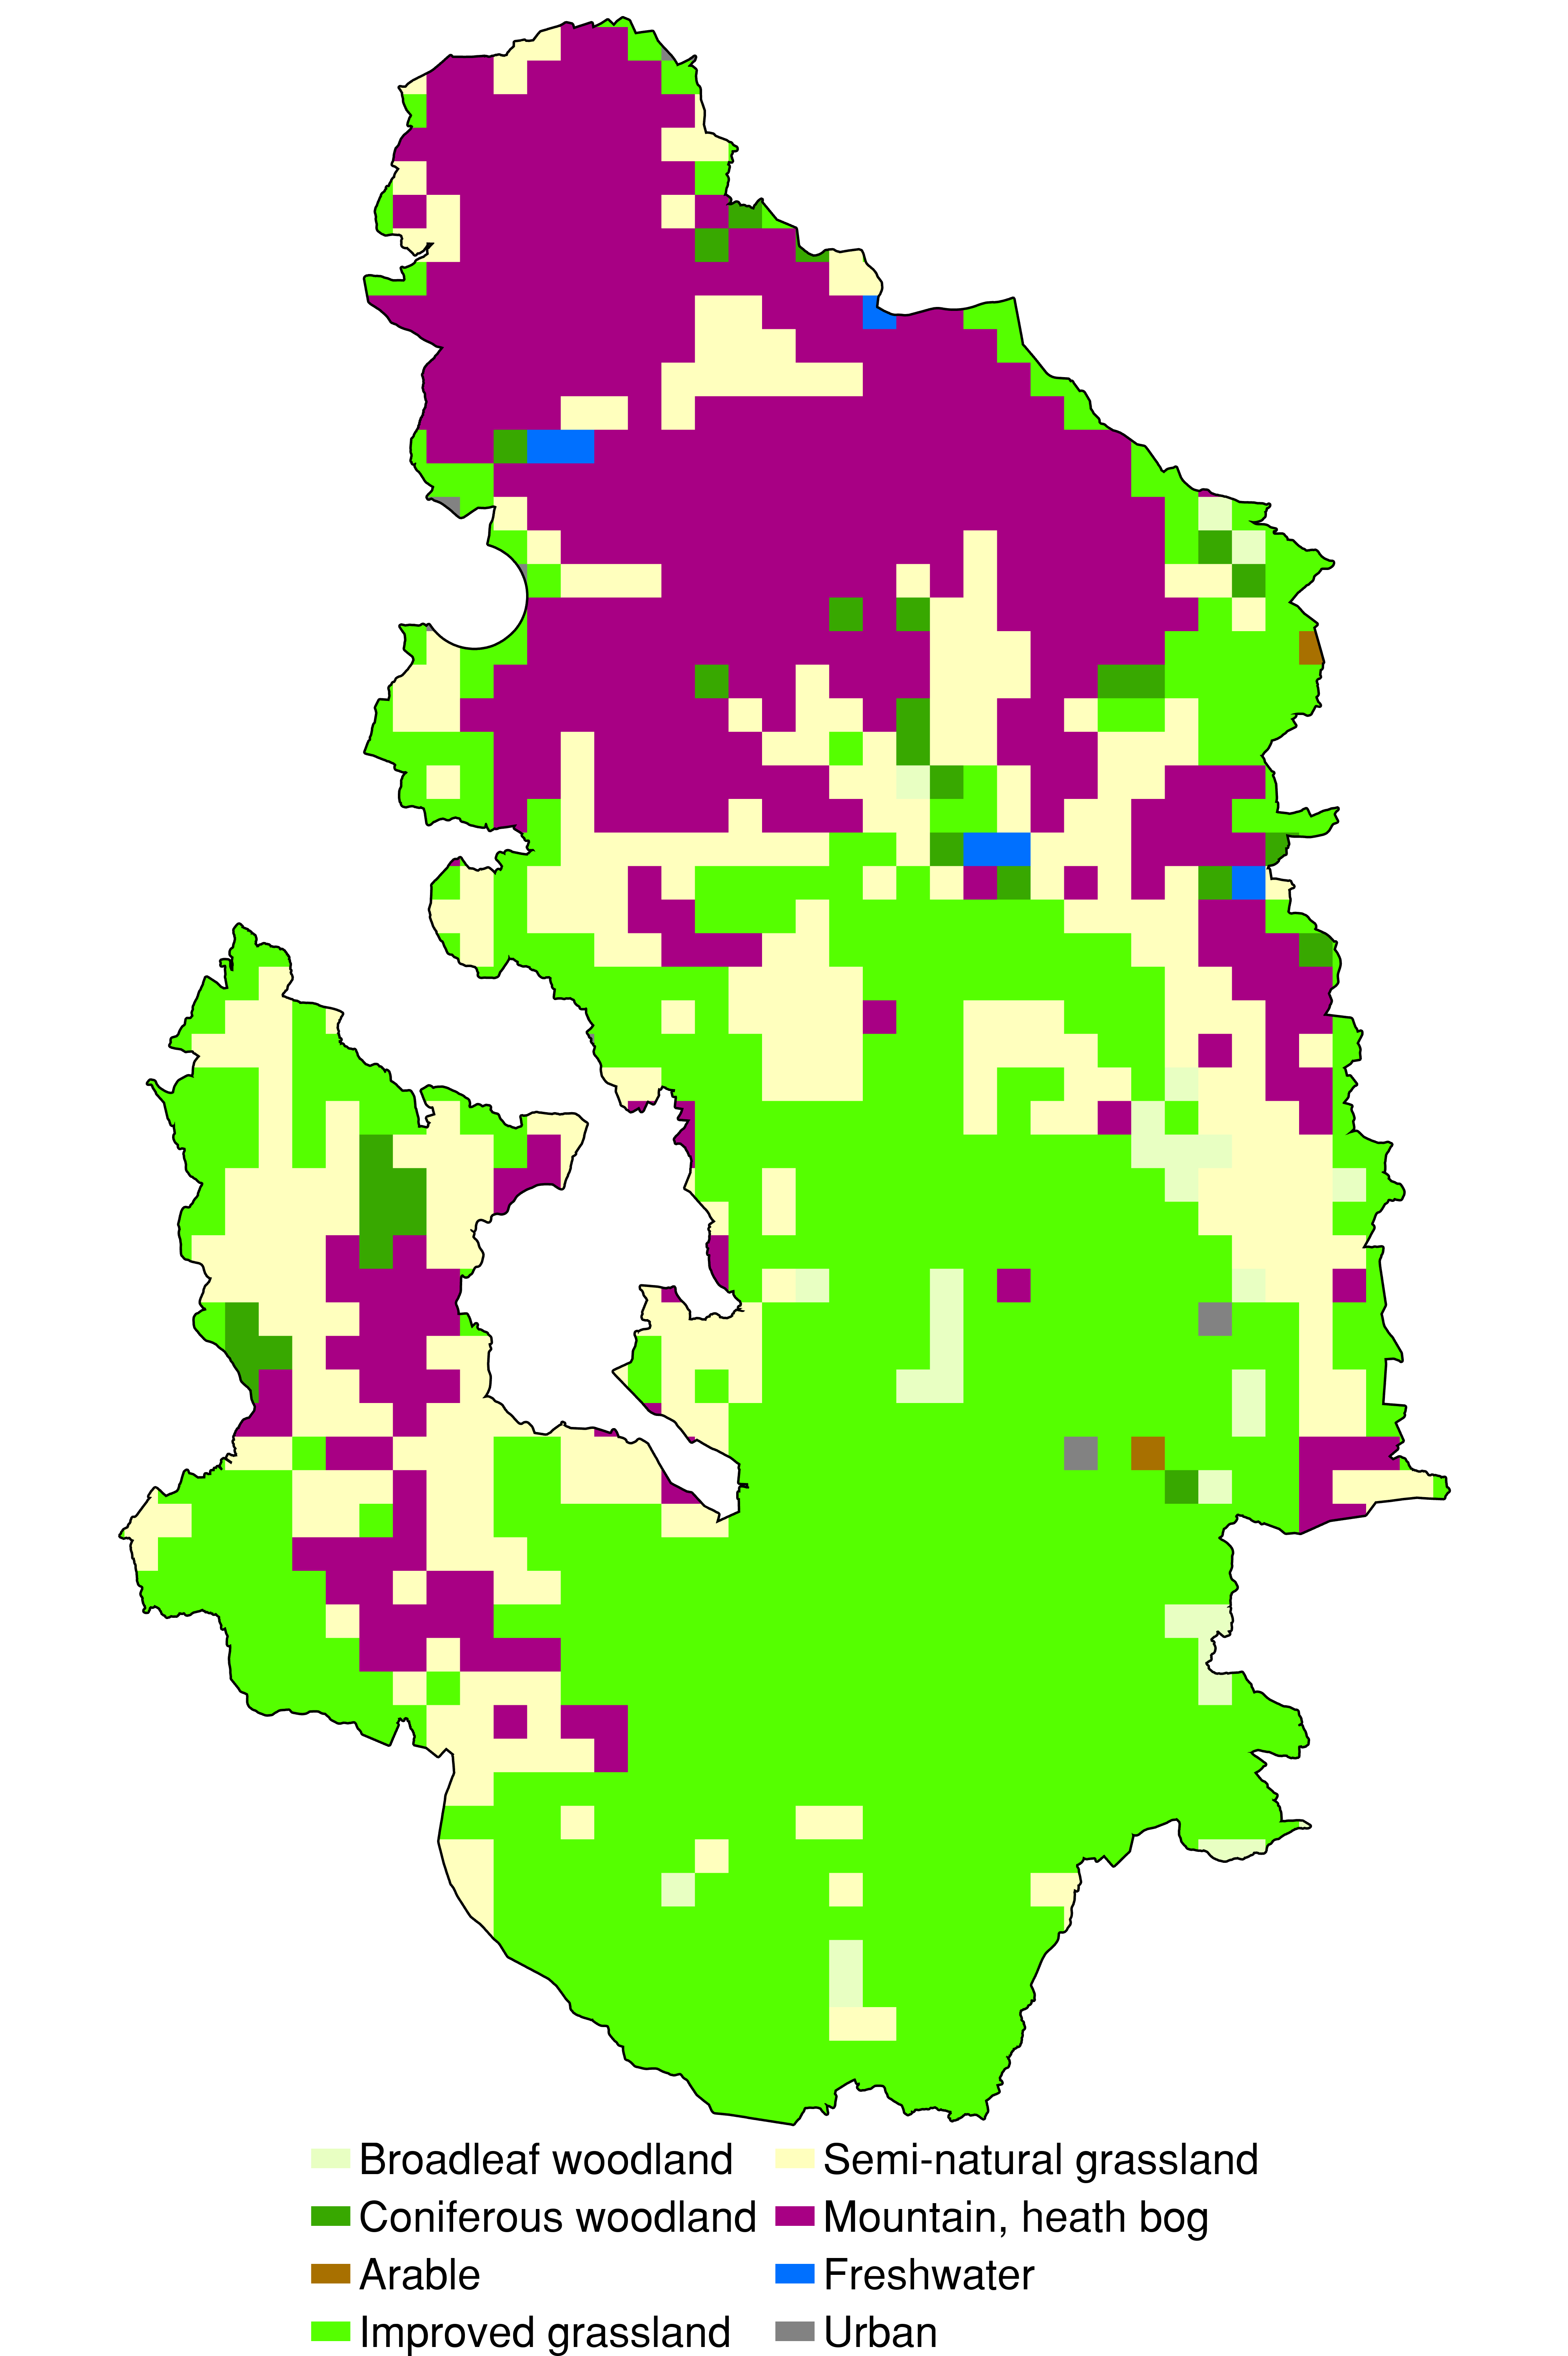
The Peak District National Park mostly lies within three National Character Areas, each with distinctive characteristics. The topography and altitude of the Peak has a significant bearing upon some types of land cover, whilst the climate will also affect the extent of certain vegetation types within the Park. Those vegeatation types particularly suited to higher altitudes (heath and moorland) are well represented within the Park mainly within the Dark Peak and South West Peak. The dominant land cover in the Peak District is improved grassland for agriculture.

Land Cover Map 2015 (1km dominant target class).
# Monitoring landscape change in the national parks (1991) [1]
Historically, the Monitoring Landscape Change in the National Parks (MLCNP) project (Taylor, Brewer et al, 2000) [2] conducted a complete census of the land cover in the national parks of England and Wales (approximately 14,000 km²) using medium scale aerial photography (1:20,000 - 1:25,000) flown in the early 1970s and the late 1980s by Ordnance Survey. Manual, stereoscopic interpretation of both dates of photography identified and mapped the land cover information onto photo overlays and 1:10,000 map sheets.
Aerial photographic interpretation was carried out to extract information on 50 types of landscape feature in the national parks of England and Wales for two time periods, the mid 1970s and the late 1980s. The aim of the work was to identify and quantify changes at different administrative levels (national park, county, district, and parish).
Between the 1980s and 1970s there was little or very little change for most types of land cover within the PDNP. The largest cover change was an overall increase in coniferous forest cover (roughly 10 km²). However, the main trends for the Peak District in terms of landscape change were losses in walls and hedges, primarily around the White Peak.
# Field boundaries
The extent of field boundaries has been in decline nationally since the mechanisation of farm machinery. The hill farms of the PDNP have suffered less by comparison, although there has still been a dramatic loss of field boundaries. Between the 1970s and 1980s, the PDNP lost 258km of field boundaries overall, the worst loss of all the National Parks, which all lost boundaries overall. This is despite the National Park area being eligible for grants to re-build damaged walls and/or re-plant hedgerows, since the 1980s.
Lengths of linear feature changes between the 1970s & 1980s
The Peak District lost 42km of hedgerows, 230km of dry-stone walls, but gained 14km of wire fences. The increase in the number of fences is largely borne out of material and labour cost effectiveness, rather than a desire for fences over traditional dry-stone walls or hedges. However, the wildlife value of a post and wire fence is practically nil, compared to a dry-stone wall or hedgerow which house a number of bird, small mammal and invertebrate species.

Chris Gilbert.
The map below shows the length of walls in the Peak District National Park in four length classes. The high concentration of walls is of particular importance to the landscape character of the White Peak area and in the map below this coincides mainly with having wall lengths of greater than 15km and particularly greater than 25km per square kilometre.
Lengths of walls per km squared in the PDNP (1980s)
Press the top left button to reveal the map key on the above
# Trends in the National Parks as a whole showed an intensification of farming
Between the 1970s and 1980s, the area of enclosed farmland increased overall although the main source of change was movement between one sort of enclosed farmland and another. There was considerable change between rough pasture, improved pasture and cultivated land as land continued to be improved for agriculture, cultivated or allowed to revert at different times. The general trend, however, was one of intensification of farming.
What are the gaps in our research & data?
The last land cover survey undertaken for national parks was by Cranfield University some 30 years ago and took 3 years to complete. The Peak District National Park Authority has been working with Cranfield University in 2020/21 to explore new techniques for mapping land cover change in national parks. We have developed a machine learning approach to classifying land cover to allow a direct measure of change detection between now and the 1980s baseline. This has been tested in one area of the PDNP with excellent results. However, as yet, no funding has been found to extrapolate this work to the full PDNP and beyond to all National Parks in England and Wales.
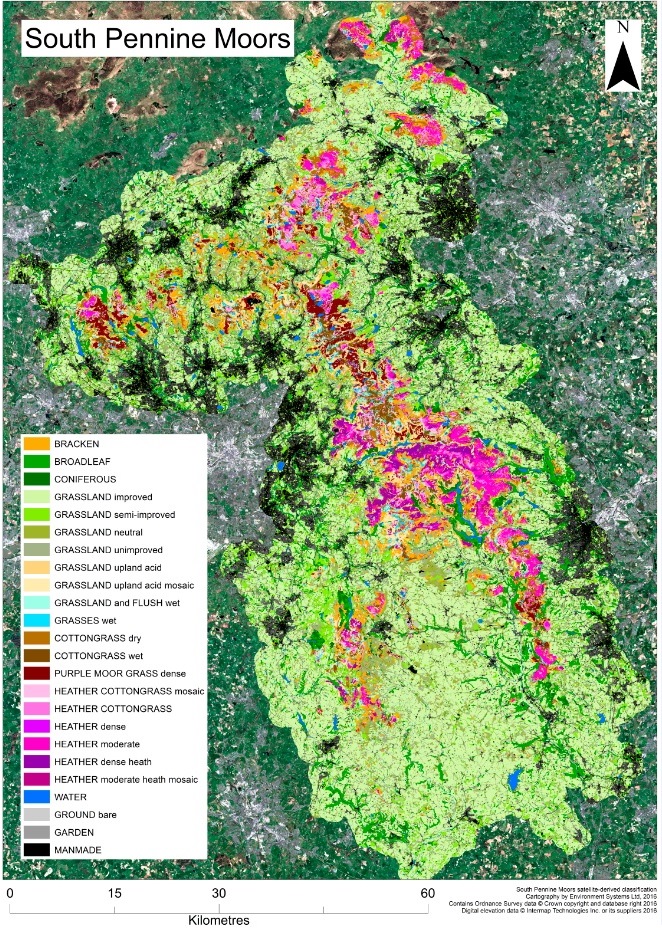
# MoorLIFE 2020: mapping vegetation on the moors [3]

Covering around 650km² of northern England, the map was created using satellite imagery together with field-survey data collected by volunteers.
The land cover map provides us with a ‘baseline’ data set which shows us the location, extent and boundaries of the different habitats and land covers present at a particular point in time. This can be used to help identify areas requiring restoration interventions as well as areas for science and monitoring.
Areas dominated by species, including heather, purple moor grass and cotton grass are of particular interest. A well-functioning blanket bog contains a rich mixture of species.
# Corine: mapping broad land cover categories [4]
This series consists of Corine Land Cover (CLC) datasets. CLC is a dataset produced within the frame of the Initial Operations of the Copernicus programme (the European Earth monitoring programme previously known as GMES) on land monitoring. CLC products are based on a a standard methodology and nomenclature with the following base parameters:
- 44 classes in the hierarchical three level Corine nomenclature;
- Minimum mapping unit (MMU) for status layers is 25 hectares;
- Minimum width of linear elements is 100 metres;
Datasets include: land cover for 2012, revised land cover for 2006 and changes in land cover between 2006 and 2012.
Corine is most useful for looking at broad habitat classes in the PDNP when compared to other rural areas and National Trends. It is less useful at identifying landscape change in detail.
Adjusted urban figures to show broad land use categories as a % of total area
| Area | Built urban | Green urban | Farmland" | Natural |
|---|---|---|---|---|
| England | 8.8 | 3.8 | 72.9 | 14.5 |
| Scotland | 2.1 | 0.9 | 26.4 | 70.7 |
| Wales | 4.2 | 1.4 | 59.3 | 35.1 |
| Peak District | 1.0 | 0.8 | 51.8 | 46.4 |
| NPE | 0.8 | 0.5 | 42.2 | 56.5 |
The table above shows only 1% of the National Park is classed as urban, unlike the England at 9% of land. Forest and other types of farmland are classed as "Natural" however this can be extracted when looking at the 44 classes in detail.
# CEH: Land cover map for broad habitat classes [5]
The CEH Landcover Maps Cover Classes based on UK Biodiversity Action Plan (BAP) Broad Habitats. Information on land cover for the whole of the United Kingdom and have been used for the management of natural resources, urban planning, carbon accounting and flood risk modelling.
CEH Land cover map with graph showing proportions within the PDNP
What are the gaps in our research and data?
Establish monitoring at a landscape scale We want to ‘join up’ and develop our monitoring work. This will deliver a clear picture ofany large-scale changes to the landscape. This requires a wide-ranging record. It must include flora, fauna, cultural and heritage features, agricultural features and land cover.
Natural England: http://publications.naturalengland.org.uk/publication/5216333889273856 ↩︎
Cranfield University: https://www.researchgate.net/publication/252534503_Monitoring_landscape_change_in_the_National_Parks_of_England_and_Wales_using_aerial_photo_interpretation_and_GIS ↩︎
https://www.moorsforthefuture.org.uk/our-work/our-projects/moorlife2020/moorlife2020-research-and-monitoring/mapping-vegetation-on-the-moors ↩︎
CEH: https://catalogue.ceh.ac.uk/documents/2fad7f16-6585-438a-9fe3-a7d68ff642f9 ↩︎
CEH: https://catalogue.ceh.ac.uk/documents/0255c014-1630-4c2f-bc05-48a6400dd045 ↩︎