Undeveloped places of tranquillity and dark night skies within reach of millions
# Dark Skies
The dark skies of the Peak District are an oasis within Northern England. However, compared to other rural areas, the Peak District could do much better.

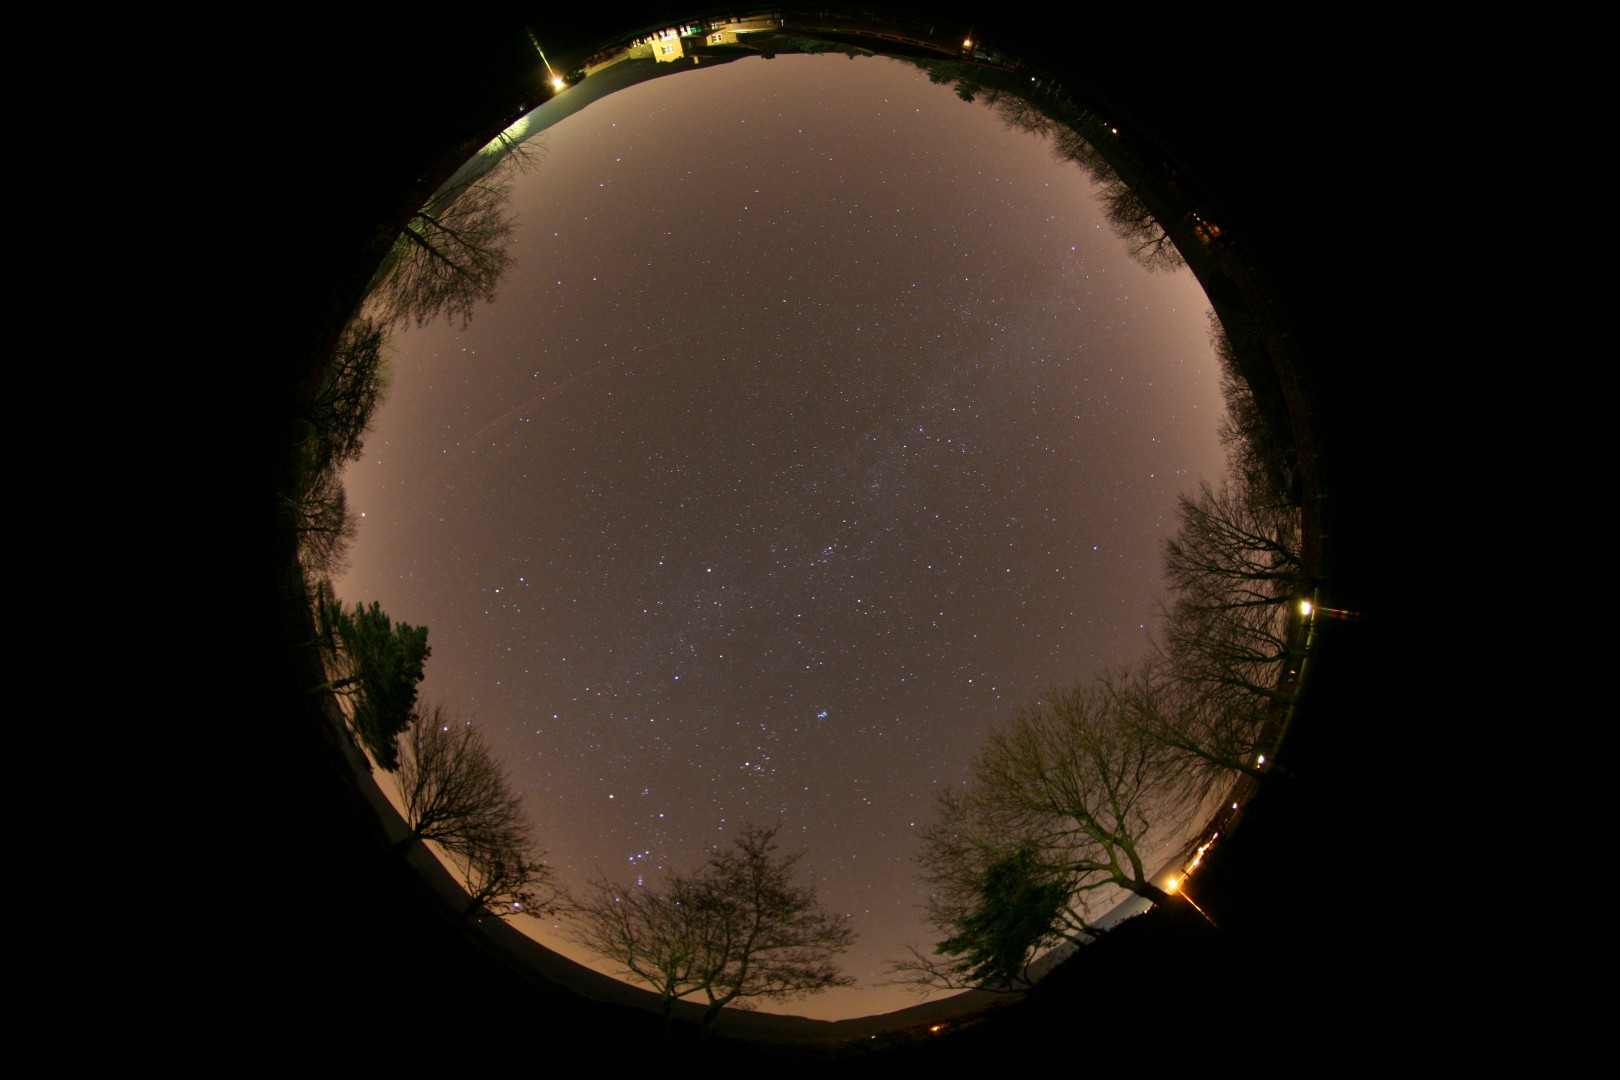
Dark Skies Surveillance Image, Moorland Centre, Edale (Macclesfield Astronomical Society).
Light pollution is a generic term referring to artificial light that shines where it is neither wanted nor needed. In broad terms, there are three types of light pollution[1]:
- skyglow – the pink or orange glow we see for miles around towns and cities, spreading deep into the countryside, caused by a scattering of artificial light by airborne dust and water droplets
- glare – the uncomfortable brightness of a light source
- light intrusion – light spilling beyond the boundary of the property on which a light is located, sometimes shining through windows and curtains

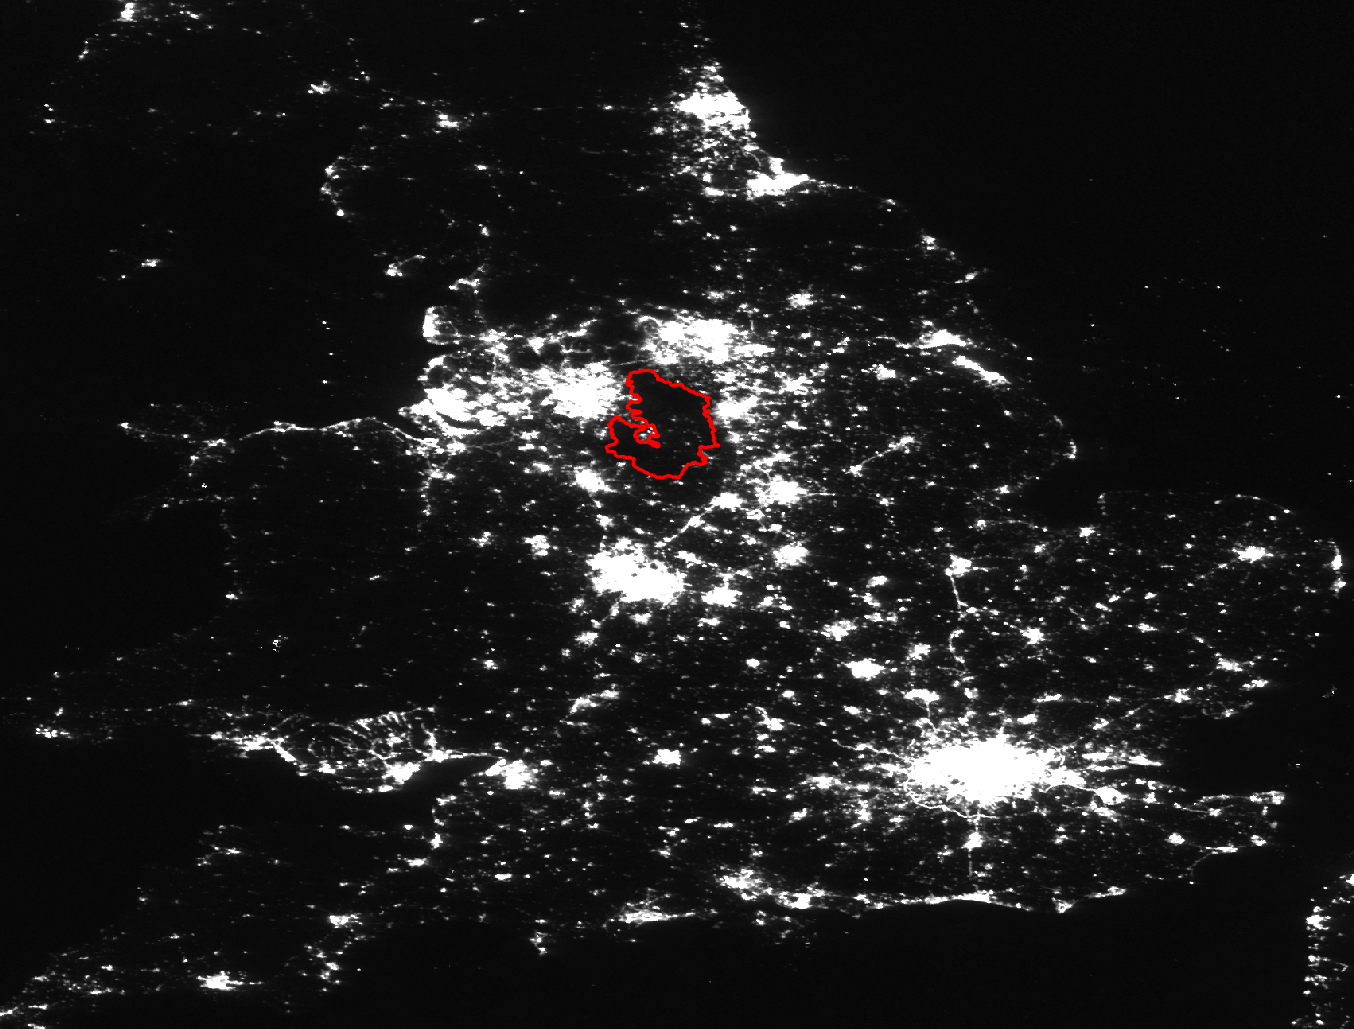
Map showing the UK from Space 2020 nanoWatts/cm2/sr with the Peak District outlined in red.
VIIRS Day/Night Band Nighttime Lights 2020 composite https://eogdata.mines.edu/download_dnb_composites.html
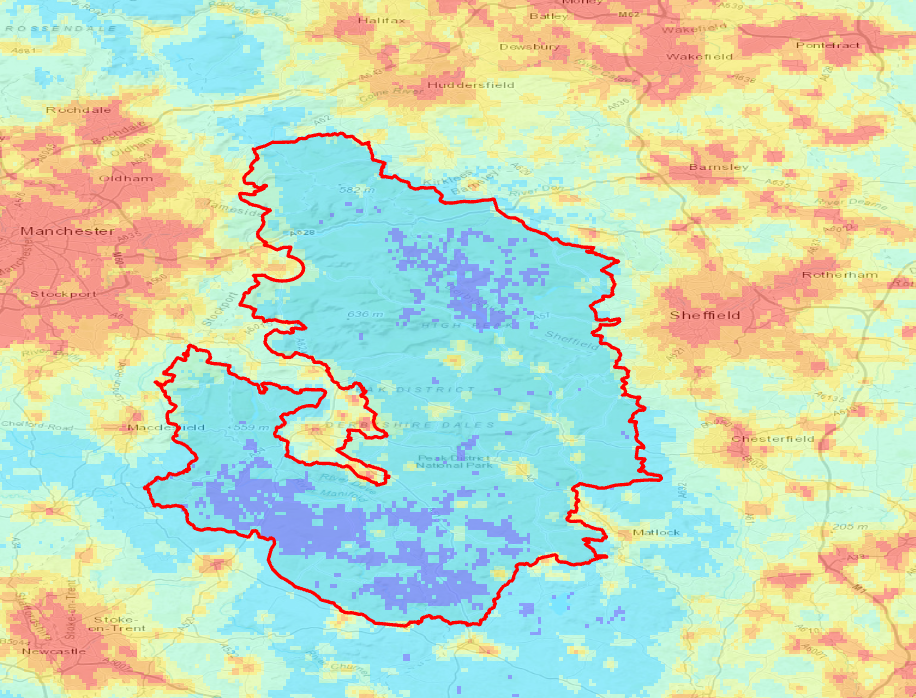
The map below shows the same data binned into manual interval data groups. The darkest skies in the Peak District are where the least populated areas are, particularly around moorland. Bakewell, Castleton and the larger settlements can clearly be seen in the map. Regionally the Peak District is an oasis of dark skies, but nationally the picture isn’t quite as good. Although the Peak District performs better than the national average for dark skies, it could perform better.
Here the data shows the Peak District has no pristine dark skies. Caution must be taken however, due to cloud and atmospheric conditions. We would expect the Dark Peak to be a 'darker sky' for example. We are working on producing annual averages based on cloud free images. This would give a more rounded picture.

Map showing VIIRS Day/Night Band Night-time Lights March 2020 PDNP nanoWatts/cm2/.
Map Legend: floating point radiance values with units in nanoWatts/cm2/sr in to class BINS
| Bin | Frequency England | Percentage England | Frequency PDNP | Percentage PDNP |
|---|---|---|---|---|
| ≤0.25 | 54321 | 5% | 0 | 0% |
| ≤0.5 | 351826 | 35% | 1652 | 15% |
| ≤1 | 262471 | 26% | 8264 | 74% |
| ≤2 | 137187 | 13% | 1073 | 10% |
| ≤4 | 76691 | 8% | 152 | 1% |
| ≤8 | 53168 | 5% | 36 | 0% |
| ≤16 | 42213 | 4% | 2 | 0% |
| >32 | 38929 | 4% | 0 | 0% |
Due to the sensitivity of the new satellites (https://eogdata.mines.edu/download_dnb_composites.html), data is not comparable with historic mapping produced by CPRE (https://www.nightblight.cpre.org.uk/maps/).
What are the gaps in our research & data?
- Mask the data with ‘built up areas’ to remove domestic light pollution
- GIS raster statistics find the lowest value in all the last year to find the 'darkest possible sky' as measured by the sensor to create a calibrated data set
CPRE: What is light pollution https://www.nightblight.cpre.org.uk/what-is-light-pollution ↩︎