Vital benefits for millions of people that flow beyond the landscape boundary
# Environmental Accounts
Environmental accounts are a statistical system bringing together economic and environmental information in a common framework to measure the contribution of the environment to the economy and the impact of the economy on the environment [1].
Environmental accounts can be used to answer questions such as:
- Which industry is emitting most greenhouse gases?
- How do patterns of consumption and production affect the environment?
- What is the effect of economic policy measures, such as an environmental tax on the generation of waste or air emissions?
- How fast is the environmental economy growing and how does it compare with the rest of the economy?
For more information see UK Environmental Accounts: 2020 (opens new window)
# Greenhouse Gas Emissions
Carbon accounts for half of the Peak District’s greenhouse gas emissions, the majority of which comes from road transport. Just over a third (37%) of greenhouse gas emissions come from methane, which is primarily from farming and agriculture (81%).
This section presents the available date on major greenhouse gas emissions (carbon dioxide, nitrous oxide and methane), including discussion of methodology and results. The analysis follows on from a similar methodology in 2010 . For this analysis, carbon dioxide (CO2), methane (CH4) and nitrous oxide (N20) data was analysed on a 1km square basis for the Peak District National Park. The. Emissions for the remaining GHGs (F-gases, HFC, PFCs and SF6) are not mapped within the NAEI and therefore it is not possible to allocate emissions to National Park boundaries. Since the sources of the F-gases are predominantly industrial, and industry is infrequent within national parks and not evenly distributed spatially, it is highly probable that the relative contributions of the F-gases to overall National Park emissions are well below the UK average, which is itself very small.
The 1km2 resolution maps are compiled within a GIS environment. Maps for each sector are generated by summing the spatially distributed proportions of the NAEI national total. The latest data available is for the year 2018 [2].
# Overall CO2 Equivalent Emissions Data
For the major emissions types (carbon dioxide as C, methane and nitrous oxide) we see that carbon accounts for half (50%) of the Peak District greenhouse gas emissions, the majority of which (62%) comes from road transport. However, 37% of greenhouse gas emissions comes from methane, of which 81% comes from farming and agriculture.
UNCE Sector Greenhouse Gas Emissions CO2 CH4 N20 & CO2 Equivalent tonnes
| UNCE Sector | Carbon | Methane | Nitrous Oxide | CO2 equivalent |
|---|---|---|---|---|
| Combustion in Energy Production and Transformation | 0.0 | 14.7 | 0.0 | 14.7 |
| Combustion in Commercial, Residential & Agriculture | 20435.8 | 982.8 | 248 | 21666.6 |
| Combustion in Industry | 6431 | 888.3 | 93 | 7412.3 |
| Production Processes | 851.7 | 0.0 | 31 | 882.7 |
| Extraction and Distribution of Fossil Fuels | 1.2 | 2116.8 | 0.0 | 2118 |
| Solvent Use | 3.3 | 69.3 | 0.0 | 72.6 |
| Road Transport | 60808.0 | 170.1 | 1953.0 | 62931.1 |
| Other Transport and Mobile machinery | 9605.8 | 46.2 | 3441.0 | 13093 |
| Waste Treatment and Disposal | 0.0 | 46153.8 | 4061.0 | 50214.8 |
| Agriculture, Forestry and Landuse Change | 31.9 | 218858.0 | 70773.0 | 289662.7 |
| Nature | 0.0 | 516.6 | 2883.0 | 3399.6 |
| Total area sources (sum of all the 1km squares) | 98168.8 | 269745.0 | 83452.0 | 451468.1 |
| Total emissions (including point sources) | 364348.3 | 270646.0 | 88350.0 | 723344.2 |
When point sources (opens new window) are removed from the data set to reflect the overall area based modelled emissions, methane consists of 60% of total emissions, the majority of which are derived from agriculture.
# Carbon emissions from transport and industry
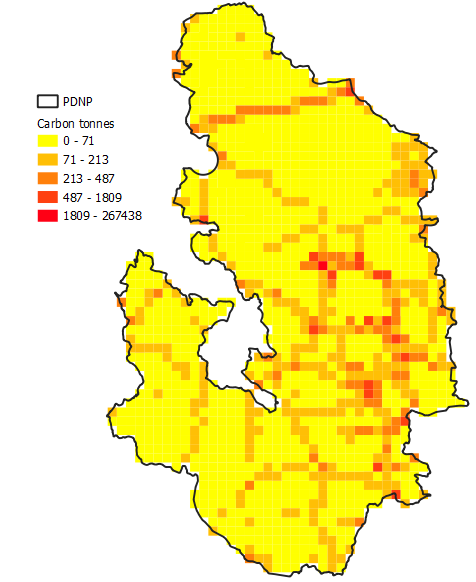
Within the Peak District National Park boundary there is only one point source of major emissions. This is the cement works in the Hope Valley and accounts for 266,179 tonnes of carbon Dioxide as C emissions. This accounts for nearly three quarters (73%) of Carbon Dioxide as C emissions in the Peak District National Park.
Excluding point sources, by far the largest CO2 emissions comes from road transport. The A road network in the Peak District National Park can be seen on the map below, particularly the A628. The link between carbon emissions and transport has been firmly established, so the continued growth in traffic across the National Park will increase carbon emissions.
1x1km Carbon Dioxide as C emissions Map Peak District National Park

The Peak District National Park is the fourth largest national park in the United Kingdom. It is surrounded by large conurbations, such as Sheffield, Manchester and Derby, which increase cross-Park movements and commuting. The Peak District National Park also attracts a high volume of tourist visits. 16.1 million people live within 40 miles or approximately one hours’ driving time of the National Park boundary. This attracts somewhere between 13 million and 26 million visitors per annum, of which we know roughly 8 in 10 come by car.
# Methane Emissions & Nitrous Oxide from land management
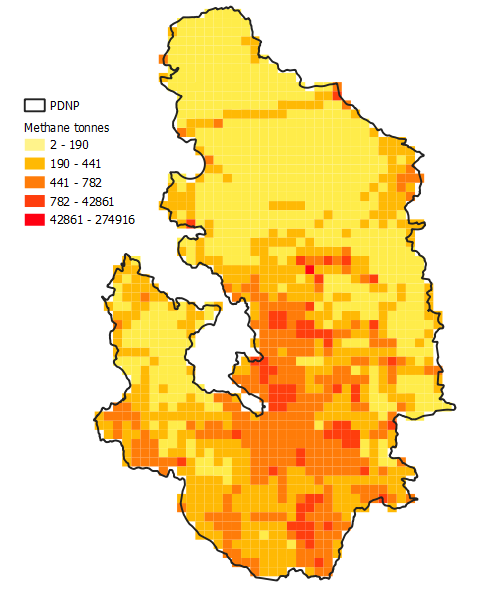
It is clear from the map below, that the majority of increased methane emission areas come from areas outside of Moorland, which are mainly located in the Dark Peak and South West Peak.
1x1km Methane as C equivalent emissions Map Peak District National Park

By far the greatest emissions of methane and nitrous oxide excluding point sources (opens new window) is agriculture. When methane emissions are plotted in the map above, we see emissions are predominantly from the White Peak and parts of the South West Peak. Nitrous oxide emissions are also highest from the agricultural sector (84% of all NO2 emissions) in the Peak District.
What are the gaps in our research & data?
- Environmental Accounts Modeling: Looking at multiple variables of environmental accounts and modeling across the landscape.