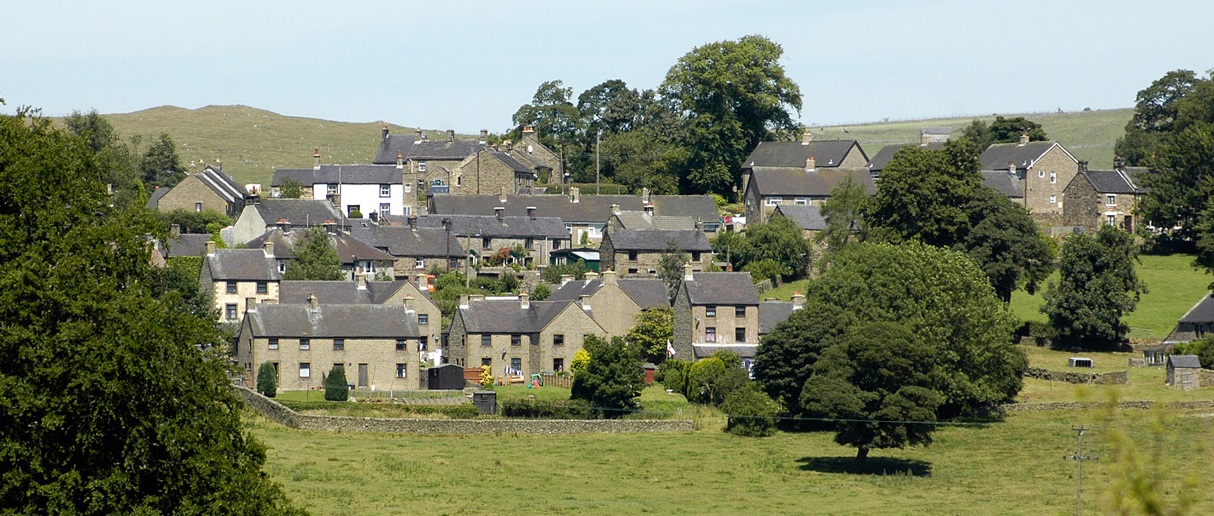
Characteristic settlements with strong communities and traditions
# Housing

# Proportion of vacant properties is below the National Park England average
From the 2011 Census in addition to identifying household spaces with at least one usual resident, the number of household spaces with no usual residents was also recorded – which provides an indication of the number of vacant properties, holiday homes and second residences. Across all PDNP, 10% of all household spaces (18,360) had no usual residents, this compares with 4 per cent nationally and 14% all National Parks in England and Wales.
Just under half of all household spaces within the Peak District National Park were detached houses or bungalows (44%) and just over a quarter (25%) were semi-detached.
Dwellings, household spaces and accommodation type (2011 Census)
| All categories: Accommodation type | Peak District | England & Wales |
|---|---|---|
| Whole house or bungalow: Detached | 43% | 25% |
| Whole house or bungalow: Semi-detached | 28% | 34% |
| Whole house or bungalow: Terraced (including end-terrace) | 21% | 26% |
| Flat, maisonette or apartment: Purpose-built block of flats or tenement | 5% | 12% |
| Flat, maisonette or apartment: Part of a converted or shared house (including bed-sits) | 2% | 3% |
| Flat, maisonette or apartment: In a commercial building | 1% | 1% |
| Caravan or other mobile or temporary structure | 0% | 0% |
The pattern of household space type within the National Park was different to that of England and Wales. The proportion of detached houses and bungalows in the PDNP was higher than for the England (25%). In contrast, the proportion of semi-detached and terraced houses and bungalows in the PDNP was slightly lower than England and Wales.
# Nearly half of all households are owned outright in the Peak District
Type of tenure refers to whether households owned or rented their accommodation. For the PDNP, a higher percentage of households lived in dwellings owned outright (46 per cent) than nationally (31%), though a smaller percentage lived in dwellings owned with a mortgage or loan (27% compared with 33%).
Of the 13 national parks, New Forest had the higher percentage of households owning their accommodation outright at 51 per cent, whilst Northumberland had the smallest percentage (35 per cent). Generally, shared ownership and rented properties were less prevalent within national parks than nationally.
Tenure of Households (2011 Census)
| Tenure | Peak District | England & Wales |
|---|---|---|
| Owned: Owned outright | 46% | 31% |
| Owned: Owned with a mortgage or loan | 27% | 33% |
| Shared ownership (part owned and part rented) | 1% | 1% |
| Social rented: Rented from council (Local Authority) | 4% | 9% |
| Social rented: Other | 6% | 8% |
| Private rented: Private landlord or letting agency | 11% | 15% |
| Private rented: Other | 2% | 1% |
| Living rent free | 3% | 1% |
A smaller proportion of households in the Peak District (4%) rented their accommodation from a social housing provider (Council / Housing Association / Registered Social Landlord) compared to England and Wales (9%).
# 15% of households are classed as one person household: Aged 65 and over compared with 12% in England and Wale
Household composition refers to the usual residents in a household and their relationship to each other. Households may be a family or they may consist of one person living alone or unrelated adults sharing. A family is a couple (married, civil partners or cohabitating), with or without children, or a lone parent with at least one child.
Of the 175,100 households within PDNP in 2011, the most reported household type was where there was one family (66%).
Comparisons can also be drawn with 2001 Census figures and national figures. Whilst across all national parks, the number of households has increased by 4.6%, nationally the number of households has increased by 7.9%. Whilst lone parent households have increased by 9% across all national parks, this was much lower than the national increase (21%). Older couple households (with all persons aged 65 and over) have also increased across all national parks (by 5%), though nationally they have declined by 2%.
# Housing Delivery in the Peak District
- Over the last 14 years, there has been 1039 completions, providing an average dwelling completion rate of 74 per annum
- Two fifths of all completions are Holiday lets
- 5 in 10 completions are for Open Market Housing
- There continues to be housing and other developments granted contrary to policy
- Increased numbers of housing commitments over the last 4 years (average of 58 per annum, includes Holiday)
# Housing Completions and commitments have decreased since the recession
Between 2006/07 and 2019/20 there has been 1039 housing completions giving an average of 74 dwellings per year. There is no statistical correlation between the commitments and completions. The largest years for commitments i.e. development, outstanding (not started), or under construction, and completions remains 2006/07, 2007/08 and 2008/09 with an average of 562 per annum. This was just before the economic crash in 2008 from which the numbers of commitments and completions has not recovered averaging around 317 per annum between 2009/10 and 2019/20.
Housing not started, under construction or completed by financial year PDNP 2006/07-2019/20
Proportion of housing completed by type of application PDNP between 2001/02-2019/20